Most business owners are uncomfortably aware of that feeling you get when your sales are down, but you don’t know why.
It’s somewhere between concern and panic, but to stay at the more practical end of the scale, a good starting point is to look in your Google Analytics data. But rather than the standard headless-chicken-blindly-pecking-at-data model (not the best thought-out name), here’s a basic seven-step process that will at least eliminate some of the more obvious explanations.
Overview – a bird’s-eye view
I’m going to take over-simplification to a whole new level here, but broadly speaking, when it comes to the cause of a sales drop, there are two categories. The first is internal – your product, your price, your presentation. And then there are the external factors – competition, economic, external infrastructure etc.
But it’s too easy to assume that the cause lies solely internally or externally, and to ignore the other factors. It’s not impossible that both may play a role.
Start by setting-up a date comparison in Analytics
Try to identify exactly when the decline in sales began. Then set up a date comparison in Google Analytics – something along the following lines:
A few things to be aware of:
- Get the dates right, or you’ll be blurring the data before you begin.
- Try to avoid major fluctuations if possible, for example national holidays or religious festivals.
- Compare in units of seven days, and compare with the same period of time.
- Don’t overlook the lag between your marketing efforts, first exposure and purchase or sign-up.
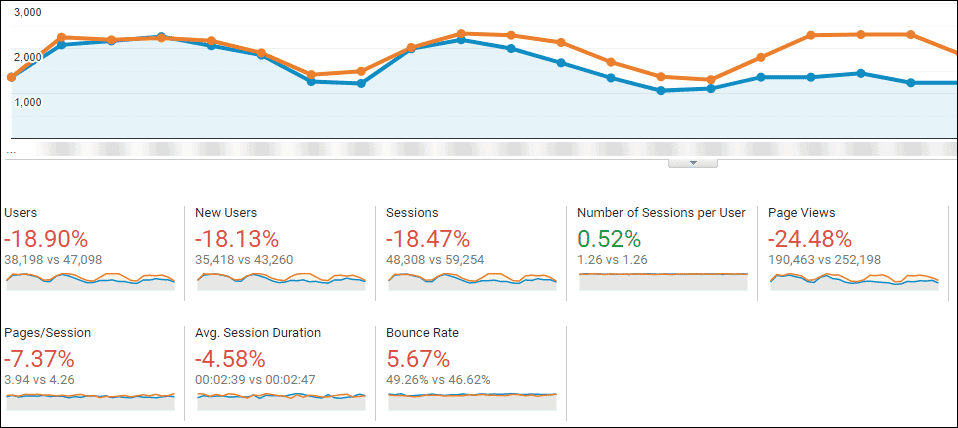
If you’re unlucky, you won’t see much of a change here. Perhaps the comparison will look something like this:
But that doesn’t mean that you won’t find what you’re looking for in Analytics.
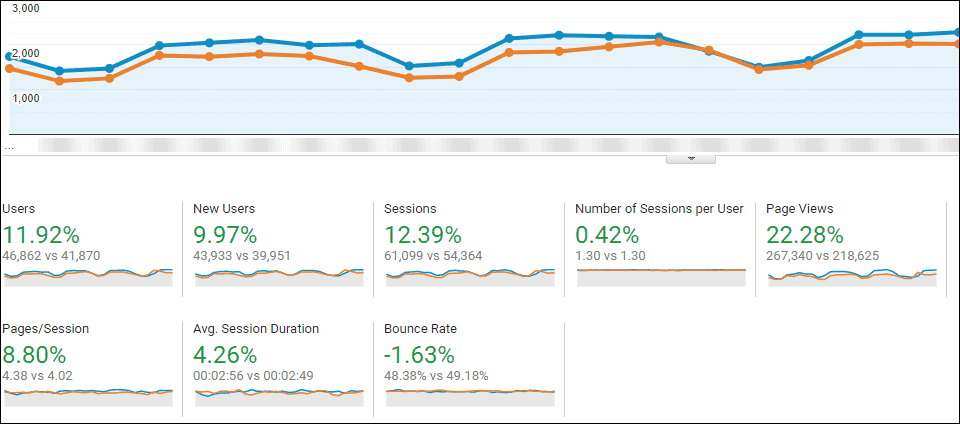
If, however, you’re lucky, you might see something like this:
In which case, there may be some answers in here.
Rather than floundering in the Vortex of Time and Data that is Google Analytics, you can begin your search by looking in the below categories.
Geographical – is the issue localised?
A good starting point is to look in Audience > Geo > Location, to see if the decline is from a particular place in the world.
If, however, the fall is more or less consistent across all or most countries, you might see something like this:
I quite like looking here as many of the reports can effectively cancel each other out. For instance, 1,000 visitors less from Google Organic might be counteracted by 1,000 visitors from social media; but the absolute number of visitors during this time can look the same.
Channels – is it one particular source?
Channels (found in Acquisition > All Traffic > Channels) separates and groups all visitors into general source types. For example organic search, referral, social, affiliates etc.
Bear in mind that a considerable amount of organic traffic will fall under direct, so pay more attention to the trends and proportions than specific numbers.
Direct seems to be a mix of organic, social, mobile, untraceable and we-just-don’t know. And also people typing in a link within their browser.
If you want to dig a little deeper, go to:
Source/medium – specific types from specific sources?
Source/Medium (found in Acquisition > All Traffic > Source/Medium) goes beyond the grouped channels, and considers each source and medium separately. For example google organic, google paid, bing organic and bing paid are all treated separately.
But the same disclaimer applies to direct; some of it will consist of organic traffic.
Also you should be able to safely ignore (direct) / (none) and (not set) / (not set).
Referrals – is the decline down to one particular website?
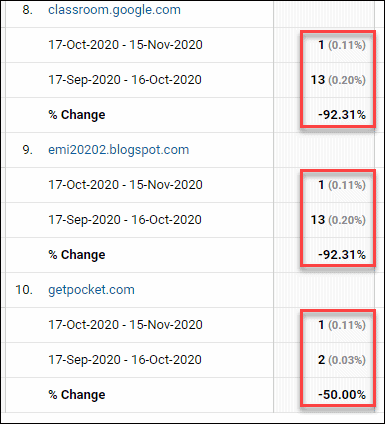
You can find specific referral information under Acquisition > All Traffic > Referrals.
For all these comparisons, pay careful attention to the absolute figures, not just the percentages:
Performance – could your sever be the culprit?
Analytics doesn’t contain as much technical analysis as some of Google’s other tools, but it can be a quick and easy starting point.
For example, Behaviour > Site Speed > Overview gives you a broad overview of various performance indicators, but pay careful attention to what exactly you’re looking at. For instance, page load times on Android Browsers may be more or less relevant than Internet Explorer.
The Page Timings (Behaviour > Site Speed > Page Timings) compares page load times with the site average, and the Speed Suggestions (Behaviour > Site Speed > Speed Suggestions) opens up a new browser window for the PageSpeed Insights tool.
Devices – are you getting more/less mobile or tablet traffic?
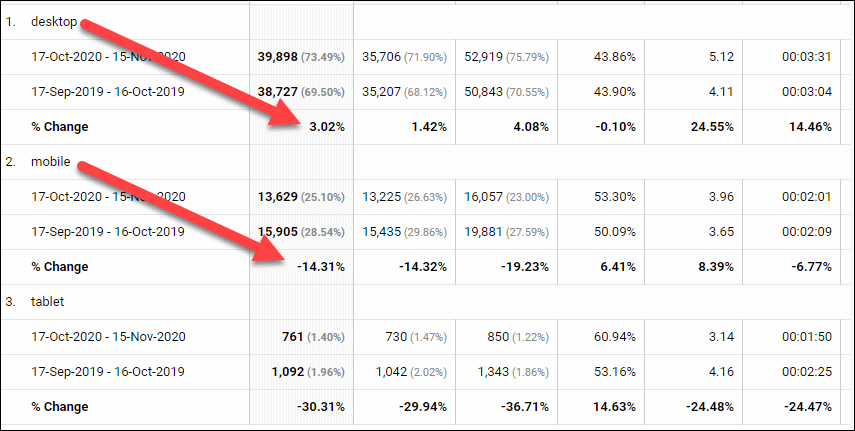
You’re probably already familiar with Google’s Mobile First index. The fact is that if your website doesn’t perform well on mobile devices and you’re now getting more visitors from them, the future isn’t quite as rosy as it may have once been!
It’s easy to misinterpret the data here, so once you’ve set up the date comparison, simply pay attention to the data table underneath the chart:
Final analytical caveats
It’s important to understand that you’re mainly viewing quantity here. For example, the number of visitors from a source. Try to also use additional quality indicators wherever you can, for example bounce rate or time spent.
And don’t overlook your sales model. If, for example, the typical period of time between a customer first coming to your website and buying from you is measured in months not days, then a change in website traffic may not affect sales for a similar period of time.
And finally, perhaps most importantly, there are many external factors to your business and website that can have a massive impact on your sales. But they won’t show up in your Analytics data.
These may include the number and actions of your competition, local or world economy, negative press or social media, your message or feature set no longer being relevant and more.
Ultimately, the cause for your decline in sales may not be reported in Analytics at all, but checking here is a lot quicker and more accurate than looking at external causes.
Unique ideas for your business
The Demystifier puts practical ideas into your hands. You won't find them elsewhere. Original, actionable and insanely effective.


